
pod如何实现container的健康运行?
我们要解决的问题是什么?为什么要有livenessProbe? 它可以解决什么问题?
Contents
一 要解决的问题:container不响应请求
前面,我们知道通过在pod级别定义restartPolicy,可以实现pod自动重启container。进而解决了当container自身出现异常、故障时,pod会自动重启这些container。进而避免了由这些container提供的服务不可用的情况出现。
可是,这样就真的比较好的解决了问题吗?
试想:container自身并没有出现故障,而是出现了比如OutOfMemory的错误,或是程序故障陷入死循环导致,不能正常对外提供服务。那么此时,pod的restartPolicy就不生效了,不会去自动重启container了。
我们该怎么解决这个问题呢?于是,人们引入了一种解决方案:livenessProbe,存活探针。它是定义在每个container级别的,用来周期性的探测该container是不是正常的。它有指定的探测的策略和时间间隔,当它发现container不正常时,就会把container失败的结果”上报“给Kubernetes,然后Kubernetes就会根据pod上的restartPolicy来判断是不是要重启这个container。
二 livenessProbe的分类
- HTTP GET probe:向container的IP和端口,加上指定的路径上,发送一个HTTP请求,如果返回值是诸如2xx或者3xx的,则认为container是healthy,否则如果返回值是不符合预期的错误码、或者请求超时了,则认为container是故障的;
- TCP socket probe:向container的IP和指定的端口上,发起1个TCP socket连接请求。如果不能建立连接,或者连接超时,则认为container是故障的,否则连接正常的话,则container是OK的。
- Exec probe: 在container内部执行一个特定的命令,根据命令的返回结果来判断命令执行是否成功,进而判定container是否正常。
三 httpGet类型的livenessProbe验证
1 kiada pod yaml
[root@master-node Chapter06]# pwd
/root/kubernetes-in-action-2nd-edition/Chapter06
[root@master-node Chapter06]# cat pod.kiada-liveness.yaml
apiVersion: v1
kind: Pod
metadata:
  name: kiada-liveness
spec:
  containers:
  - name: kiada
    image: luksa/kiada:0.2
    ports:
    - name: http
      containerPort: 8080
    livenessProbe:
      httpGet:
        path: /
        port: 8080          #没有指定initialDelaySeconds、periodSeconds、timeoutSeconds、failureThreshold,其采用默认值,分别为10,10,1,3.
  - name: envoy
    image: luksa/kiada-ssl-proxy:0.1
    imagePullPolicy: Always
    ports:
    - name: https
      containerPort: 8443
    - name: admin
      containerPort: 9901
    livenessProbe:
      httpGet:
        path: /ready
        port: admin
      initialDelaySeconds: 10
      periodSeconds: 5
      timeoutSeconds: 2
      failureThreshold: 3
[root@master-node Chapter06]#
2 创建pod
[root@master-node Chapter06]# kubectl apply -f pod.kiada-liveness.yaml
pod/kiada-liveness created
[root@master-node Chapter06]# kubectl get pods -owide
NAME                       READY   STATUS      RESTARTS        AGE   IP             NODE     NOMINATED NODE   READINESS GATES
curl                       1/1     Running     14 (2d8h ago)   17d   10.244.2.245   node-2   <none>           <none>
curl-with-ambassador       2/2     Running     0               40d   10.244.1.47    node-1   <none>           <none>
downward                   1/1     Running     0               40d   10.244.1.45    node-1   <none>           <none>
fortune-configmap-volume   2/2     Running     0               48d   10.244.2.235   node-2   <none>           <none>
fortune-https              2/2     Running     0               47d   10.244.2.236   node-2   <none>           <none>
kiada-liveness             2/2     Running     0               7s    10.244.2.248   node-2   <none>           <none>
my-job-jfhz9               0/1     Completed   0               17d   10.244.2.244   node-2   <none>           <none>
[root@master-node Chapter06]#
3 livenessProbe的字段含义
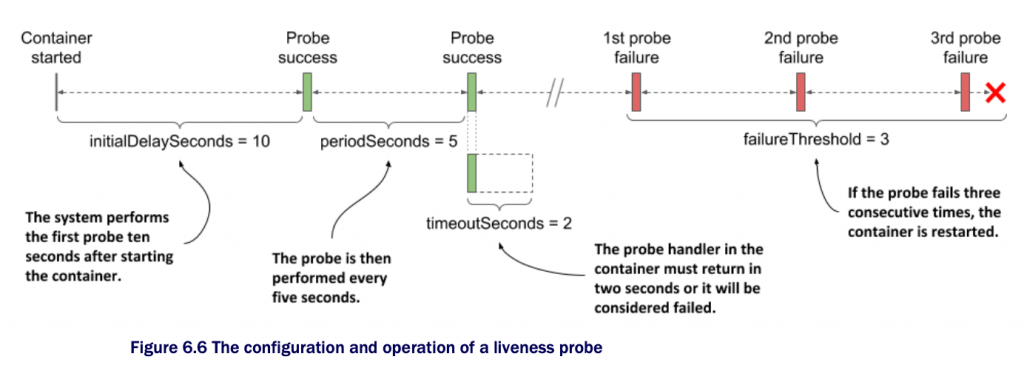
initialDelaySeconds: 表示,当container启动多久以后,开始执行livenessProbe探测;默认值是10秒; periodSeconds: 表示,每间隔多久重复执行livenessProbe探测;默认值是10秒; timeoutSeconds: 表示,在多久时间范围内,没收到container的响应请求,认为container失败1次;默认值是1秒; failureThreshold: 连续失败多少次,就认为container是彻底失败了,开始restart container;默认值是3次;
上述2个container分别设置了livenessProbe,其中第一个container kiada的livenessProbe没有显示指定相关字段,均采用默认值。表示,当container启动10秒以后,开始执行livenessProbe,如果在1秒内没有收到请求,记作container失败一次,间隔10秒之后,重复执行livenessProbe,如果联系3次都失败了,那么就开始重启这个container;
第二个container envoy显示指定了这几个字段,就按照指定的参数值来执行livenessProbe。
4 开启port-forward
[root@master-node ~]# kubectl port-forward --address=172.16.11.168 kiada-liveness 8080 8443 9901
Forwarding from 172.16.11.168:8080 -> 8080
Forwarding from 172.16.11.168:8443 -> 8443
Forwarding from 172.16.11.168:9901 -> 9901
Handling connection for 9901
5 监控events:kubectl get events -w
[root@master-node ~]# kubectl get events -w LAST SEEN TYPE REASON OBJECT MESSAGE ...
6 客户端向envoy container发起请求,模拟故障
$ curl -X POST 172.16.11.168:9901/healthcheck/fail OK asher at MacBook-Air-3 in ~ $
7 再次查看events
[root@master-node ~]# kubectl get events -w
LAST SEEN   TYPE      REASON                 OBJECT               MESSAGE
...
0s          Warning   EvictionThresholdMet   node/master-node     Attempting to reclaim ephemeral-storage
0s          Warning   Unhealthy              pod/kiada-liveness   Liveness probe failed: HTTP probe failed with statuscode: 503
0s          Warning   Unhealthy              pod/kiada-liveness   Liveness probe failed: HTTP probe failed with statuscode: 503
0s          Warning   Unhealthy              pod/kiada-liveness   Liveness probe failed: HTTP probe failed with statuscode: 503
0s          Normal    Killing                pod/kiada-liveness   Container envoy failed liveness probe, will be restarted
0s          Normal    Pulling                pod/kiada-liveness   Pulling image "luksa/kiada-ssl-proxy:0.1"
0s          Normal    Pulled                 pod/kiada-liveness   Successfully pulled image "luksa/kiada-ssl-proxy:0.1" in 2.760213466s
0s          Normal    Created                pod/kiada-liveness   Created container envoy
0s          Normal    Started                pod/kiada-liveness   Started container envoy
从上,我们可以看到,连续livenessProbe开始工作,并且探测到连续3次错误,Liveness probe failed: HTTP probe failed with statuscode: 503 出现3行之后。container被杀死,然后重启了。
验证了我们的livenessProbe符合我们的预期开始工作。
说明:当我们的客户端执行curl -X POST 172.16.11.168:9901/healthcheck/fail向container发起请求,模拟故障之后,在master上看到Liveness probe failed: HTTP probe failed with statuscode: 503。此时,我们再次向container发起请求,模拟container恢复正常之后,Kubernetes的livenessProbe不会再次认为container故障,并重启了。
发起正常请求的命令是:
$ curl -X POST 172.16.11.168:9901/healthcheck/ok OK asher at MacBook-Air-3 in ~ $
8 查看envoy这个container被重启的细节
kubectl describe pod kiada-liveness
[root@master-node Chapter06]# kubectl describe pod kiada-liveness
Name:         kiada-liveness
Namespace:    default
Priority:     0
Node:         node-2/172.16.11.161
...
Containers:
  kiada:
...
 envoy:
    Container ID:   docker://5d8c136443f477606fc79114e020c75a9b2249612ac3376764cdcfec35246a61
    Image:          luksa/kiada-ssl-proxy:0.1
    Image ID:       docker-pullable://docker.io/luksa/kiada-ssl-proxy@sha256:ee9fc6cfe26a53c53433fdb7ce0d49c5e1bffb889adf4d7b8783ae9f273ecfe7
    Ports:          8443/TCP, 9901/TCP
    Host Ports:     0/TCP, 0/TCP
    State:          Running
      Started:      Fri, 27 May 2022 18:30:43 +0800
    Last State:     Terminated
      Reason:       Completed
      Exit Code:    0
      Started:      Fri, 27 May 2022 18:25:39 +0800
      Finished:     Fri, 27 May 2022 18:30:40 +0800
    Ready:          True
    Restart Count:  1
    Liveness:       http-get http://:admin/ready delay=10s timeout=2s period=5s #success=1 #failure=3
    Environment:    <none>
    Mounts:
      /var/run/secrets/kubernetes.io/serviceaccount from kube-api-access-2mz9d (ro)
我们看到,envoy的信息:Last State: Terminated,Exit Code: 0,这里的退出代码是0,意味着,envoy是优雅的自动停止了。而不是被kill了,如果是kill的,则可以看到退出代码是137.
查看container被重启前的日志:kubectl logs kiada-liveness -c envoy -p
注意这里的-p表示的是previous,该container前一次的日志。
[root@master-node Chapter06]# kubectl logs  kiada-liveness -c envoy -p
...
[2022-05-27 10:30:40.441][1][warning][main] [source/server/server.cc:493] caught SIGTERM
[2022-05-27 10:30:40.441][1][info][main] [source/server/server.cc:613] shutting down server instance
[2022-05-27 10:30:40.441][1][info][main] [source/server/server.cc:560] main dispatch loop exited
[2022-05-27 10:30:40.442][1][info][main] [source/server/server.cc:606] exiting
[root@master-node Chapter06]#
意味着,container的进程被优雅的退出了。
9 envoy的livenessProbe工作流程图
四 tcpSocket类型的livenessProbe举例
如果container不支持HTTP请求的场景,可以使用tcpSocket类型的livenessProbe来验证container是否正常。
livenessProbe:
  tcpSocket:          #A
    port: 1234        #A
  periodSeconds: 2    #B
  failureThreshold: 1 #C

 #A This tcpSocket probe uses TCP port 1234
#B The probe runs every 2s
#C A single probe failure is enough to restart the container
向container的1234端口发送tcp socket连接请求,如果在2s内不能建立连接,且失败1次,则认为container异常,需要restart。
五 exec类型的livenessProbe举例
对于HTTP get和tcp socket都不支持的container,可以通过exec类型来实现,探测container是否正常。
 livenessProbe:
   exec:
     command: #A
     - /usr/bin/healthcheck #A
   periodSeconds: 2 #B
   timeoutSeconds: 1 #C
   failureThreshold: 1 #D
#A The command to run and its arguments
#B The probe runs every second
#C The command must return within one second
#D A single probe failure is enough to restart the container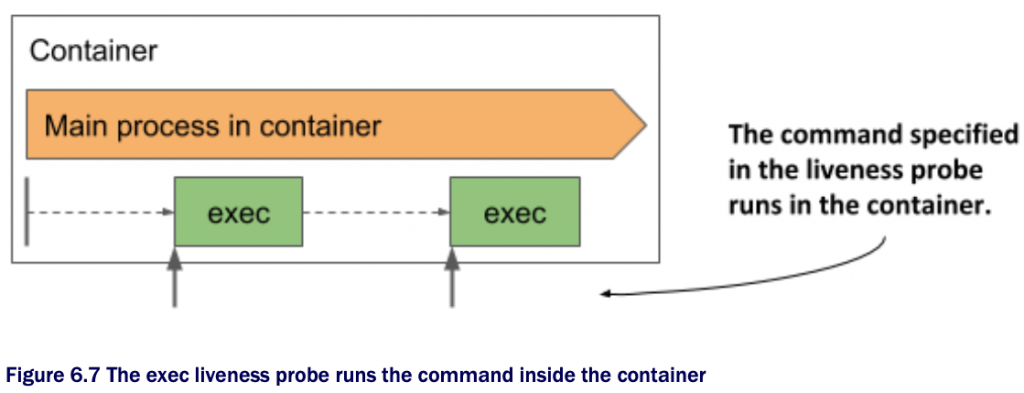
六 小结和参考
在pod上设置了restartPolicy来重启container的缺陷:当container表面看正常运行,但是当它陷入类似Java程序的内存溢出,或者OOM时,其实container是异常的,不能对外提供服务。而此时,pod是不会尝试重启container来解决问题。
我们可以通过给container加上livenessProbe来定期的探测container健康状况,从而确保container的正常运行。
对于生产环境的pod,我们都建议根据实际情况给container加上livenessProbe,来确保container的正常运行。
《Kubernetes in Action Second Edition》 Marko luksa
Chapter 06 managing the lifecycle of the Pod’s containers P152–P158.
一条评论
Pingback: